이진 분류, 이진 교차 엔트로피
선요약
이진 분류: 데이터를 두개의 그룹으로 나누는 작업
이진 분류 모델: 데이터를 받아 0~1사이의 숫자를 출력
이 숫자는 데이터가 특정 그룹에 속할 확률, 보통 0.5를 기준으로 그룹을 분류
이진 교차 엔트로피: 그 모델의 예측이 얼마나 정확한지 측정하는 방법
모델이 맞추면 낮은 점수, 틀리면 높은 점수를 부여함
- 모델이 랜덤하게 예측
- 이진 교차 엔트로피로 모델의 성능을 평가
- 성능 개선
- 모델의 예측 정확성 증대
1. 이진 분류
이진 분류는 주어진 데이터를 사전에 정의된 두 가지 범주 중 하나로 분류하는 과정
- 예시
붓꽃의 종류 분류, lris-versicolor(1) or lris-setosa(0)
이메일 스팸 분류, Spam(1) or Ham(0)
트레이닝 데이터 준비 및 Dataset & DataLoader 클래스
붓꽃의 종류(Species), 꽃받침의 길이(SepalLengthCm)와 너비(SepalWidthCm), 꽃잎의 길이(PetalLengthCm)와 너비(PetalWidthCm)이 담긴 데이터셋
이진 분류 모델 (로지스틱 회귀)
로지스틱 회귀는 선형 모델에 시그모이드 함수를 적용하여 이진 분류를 수행
class BinaryClassificationModel(nn.Module):
def __init__(self):
super(BinaryClassificationModel, self).__init__()
self.linear = nn.Linear(1, 1)
self.sigmoid = nn.Sigmoid()
def forward(self, x):
z = self.linear(x)
return self.sigmoid(z)
model = BinaryClassificationModel()
> 이진 분류는 데이터를 두 개의 클래스로 구분
> 로지스틱 회귀는 이진 분류의 기본적인 모델
---
## 2. 이진 교차 엔트로피 (Binary Cross Entropy)
$$E(w,b) = -\sum_{i=1}^n {t_i \log y_i + (1-t_i) \log(1-y_i)}$$
$$t_i$$는 실제 레이블(0 또는 1)
$$y_i$$는 모델의 예측 확률
# **핵심 개념**
- 조건부 확률:
$$P(T=t|x)$$
- 가능도 함수:
$$L(\theta;X) = \prod_{i=1}^n P(x_i|\theta)$$
- 로그 가능도 함수:
$$\log L(\theta;X) = \sum_{i=1}^n \log P(x_i|\theta)$$
# 이진 분류 모델 학습
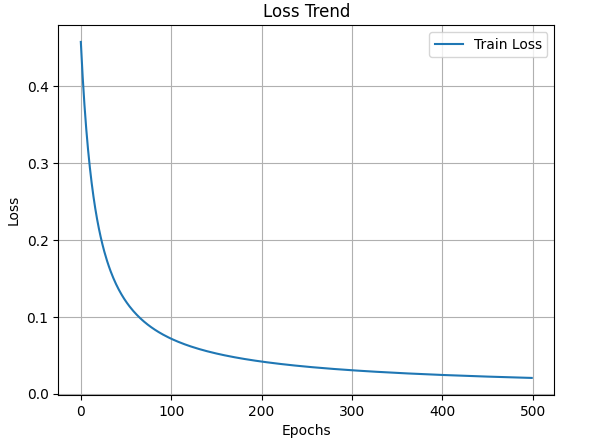
num_epochs = 500
loss_list = []
for epoch in range(num_epochs):
model.train()
epoch_loss = 0
for batch_features, batch_labels in train_loader:
optimizer.zero_grad()
outputs = model(batch_features)
loss = loss_function(outputs, batch_labels)
loss.backward()
optimizer.step()
epoch_loss += loss.item()
loss_list.append(epoch_loss / len(train_loader))
if (epoch+1) % 100 == 0:
print(f'Epoch [{epoch+1}/{num_epochs}], Loss: {loss.item()}')
# 손실 값 변화 시각화
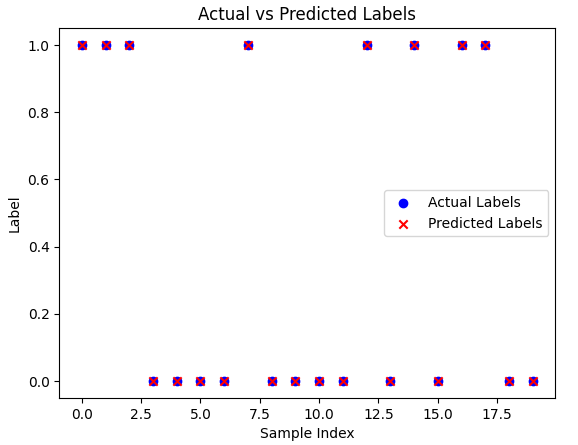
 # 이진 분류 모델의 테스트 및 시각화
model.eval()
with torch.no_grad():
predictions = model(x_test)
predicted_labels = (predictions > 0.5).float()
actual_labels = t_test.numpy()
predicted_labels = predicted_labels.numpy()
print("Predictions:", predicted_labels.flatten())
print("Actual Labels:", actual_labels.flatten())
 > 이진 교차 엔트로피는 이진 분류 문제에 특화된 손실 함수
> 최대 가능도 추정은 모델 파라미터를 최적화하는 통계적 방법
> 모델 평가 시 예측 확률을 임계값(일반적으로 0.5)과 비교하여 클래스를 결정
> 이진 교차 엔트로피는 이진 분류 문제에 특화된 손실 함수
> 최대 가능도 추정은 모델 파라미터를 최적화하는 통계적 방법
> 모델 평가 시 예측 확률을 임계값(일반적으로 0.5)과 비교하여 클래스를 결정